GREAT Tutorial
This quick tutorial will guide you through the generation of an Enrichment Map for an analysis performed using Genomic Region Enrichment Annotation Tool (GREAT),
Files
Download the test data: GREATTutorial.zip
Description of the tutorial files contained in the GREATTutorial folder:
TestRegions_ForGREAT.bedExample GREAT genomic region input file.GreatExprotAll.tsvExample of download GREAT output file.20140919-public-2.0.2-3vD5MB-hg19-all-gene.txtExample downloaded GREAT gene to region association file.geneToRegionExpressionFile.txtTransformed gene to region association file downloaded from GREAT.
Step 1: Generate GREAT output files
- GO to GREAT website
- Select Species Assembly associated with your data. For this tutorial select Human: GRCh37
- In Test regions click on Choose File
- Navigate to files provided and select TestRegions_forGreat.bed
- Click on Submit
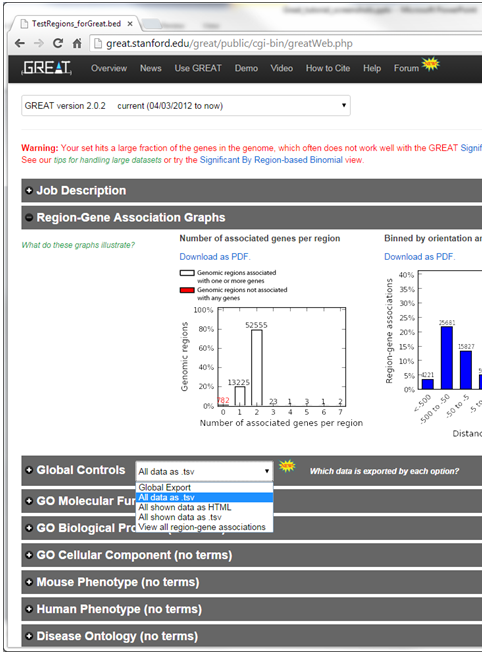
- Once the results page has loaded download all the results - in the Global controls heading click on the down arrow next to Global Export
- Select All data as tsv - greatExportAll.tsv will automatically be downloaded to your default Downloads directory. This is the file you can use in Enrichment Map (Dataset 1 or 2:Enrichment Results)
Step 1B (Optional): Generate Gene to region association file
Optional - Download the Gene-to-region used by GREAT and modify it to be used in EM as an expression file.
- In the Global controls heading click on the down arrow next to Global Export
- Select view all region-gene associations
- Next to Gene > genomic region association table [The table on the right hand side of the page] click on Download table as text.
- File will automatically downloaded into your default Downloads directory (file name is similar to DATE-public-2.0.2-3vD5MB-hg19-all-gene.txt where DATE is the date of download. Name will also change depending on the version of GREAT and genome selected).
- Open the downloaded file in Excel.
- Add a row to the top of the file.
- In the first column enter “Name”, and in the second column enter “Description”
Step 2: Generate Enrichment Map with GREAT Output
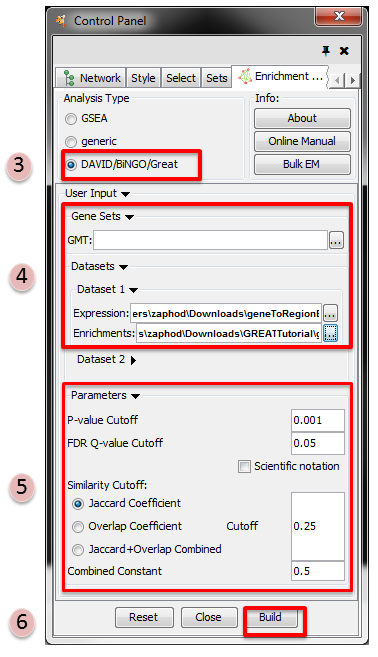
- Open Cytoscape
- Click on Apps / Enrichment Maps / Load Enrichment Results
- Make sure the Analysis Type is set to DAVID/BiNGO/GREAT
- Please select the following files by clicking on the respective (…) button and selecting
the file in the Dialog:
- NO GMT file is required for GREAT Analysis
- Dataset 1 / Expression:
!geneToRegionExpressionFile.txt(OPTIONAL) - Dataset 1 / Enrichments:
!GreatExportAll.tsv
- Tune Parameters
- P-value cut-off 0.001
- Q-value cut-off 0.05
- Jaccard coefficient cut-off 0.25
- Build Enrichment Map
Step 3: Filtering GREAT results
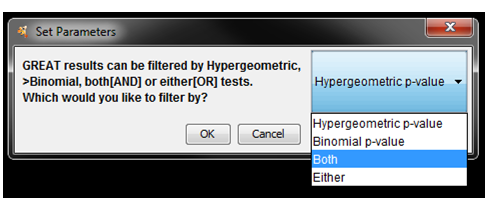
- Once the network starts to build a dialog will pop up asking you how you would
like to filter the GREAT results. There are four options:
- Use Hypergeometric test p-values and FDR only –> Hypergeometric
- Use Binomial test p-values and FDR only. –> Binomial
- Use both hypergeometric and binomial test p-values and FDR. Enrichment result must pass threshold for both tests. –> Both
- Enrichment result must pass one of the above tests to be included in the results –> Either
- Select Both
Step 4: Examining Results
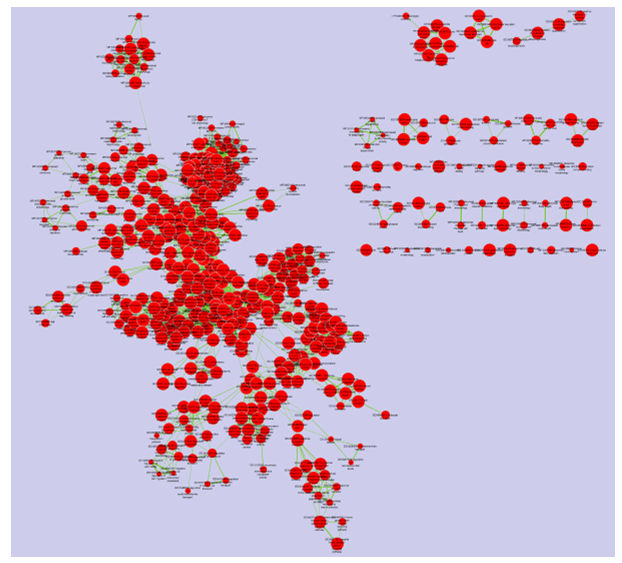
Legend:
- Node (inner circle) size corresponds to the number of genes in dataset 1 within the geneset
- Colour of the node (inner circle) corresponds to the significance of the geneset for dataset 1.
- Edge size corresponds to the number of genes that overlap between the two connected genesets.