Additional Features
Launch Enrichment Map from the command line
Requirements:
- Enrichment Map v1.3 or higher
- Commandtool App - available from Cytsocape App store.
- GSEA results in an edb directory
Command tool can be used from:
- the command line
java -Xmx1G -jar "{path_to_cytoscape_dir}\cytoscape.jar" -p "{path_to_plugin_dir}\plugins" -S "{path_to_script_file}"``
- cytoscape command window
- Plugins->commandtool–>Command Window…
- script file
- Plugins->commandtool–>Run Script…
Command Options:
enrichmentmap build: Build an enrichment map from GSEA results (in an edb directory)
  Arguments:
    [edbdir=value] --> REQUIRED
    [expressionfile=value] --> OPTIONAL
    [overlap=value] --> OPTIONAL
    [pvalue=value] --> OPTIONAL
    [qvalue=value] --> OPTIONAL
    [similaritymetric=value] --> OPTIONAL
    [combinedconstant=value] --> OPTIONAL
Example Command (for command window):
enrichmentmap build edbdir="{path_to_edb_directory}" pvalue=0.01 qvalue=0.1 overlap=0.5
                    similaritymetric="jaccard" expressionfile="{path_to_expression_file}"
Calculate Gene set relationships
To analyze the relationships that exists between genesets in the absence of an enrichment analysis an Enrichment map can be built with just the gene set definition file.
In the input panel specify only a gmt file and click on build.
Warning
This task requires a lot of memory. In a normal enrichment analysis we compute similarities only for the gene sets that pass the thresholds in addition to constraining the genes of the gene sets by the given expression set which drastically decreases the computations of similarity required. The smaller the gmt file the less memory required.
GSEA Leading Edge Functionality
For every gene set that is tested for significance using GSEA there is a set of proteins in that gene set defined as the Leading Edge. According to GSEA the leading edge is:
“the subset of members that contribute most to the ES. For a positive ES, the leading edge subset is the set of members that appear in the ranked list prior to the peak score. For a negative ES, it is the set of members that appear subsequent to the peak score.”
In essence, the leading edge is the set of genes that contribute most to the enrichment of the gene set.
For Enrichment Map, leading edge information is extracted from the gsea enrichment results files from the column denoted as Rank at Max. Rank at max is the rank of the gene where the ES score has the maximal value, i.e. the peak ES score. Everything with a better rank than the rank at max is part of the leading edge set.
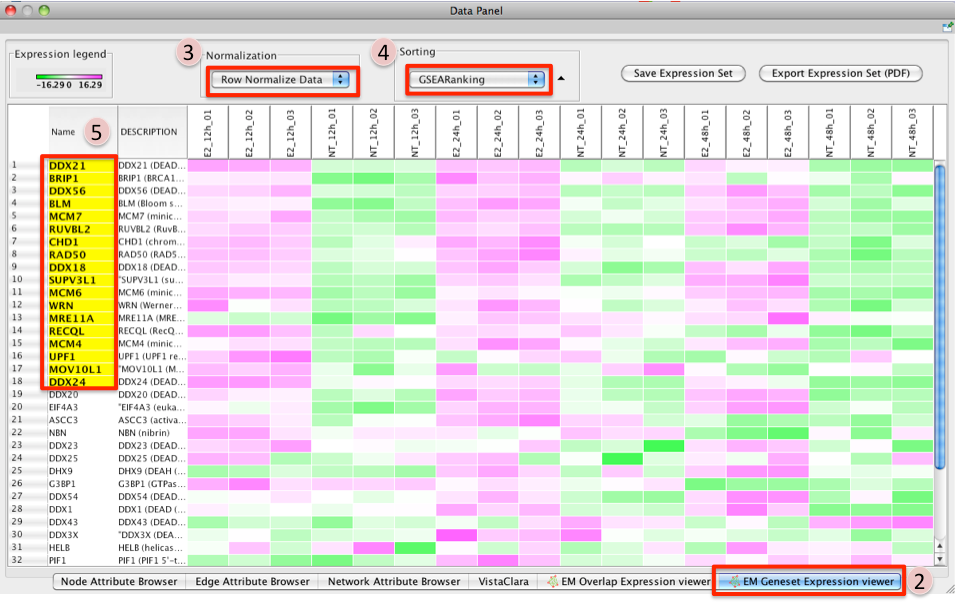
- To access GSEA leading edge information click on an individual Node. Leading edge information is currently only available when looking at a single gene set.
- In the Data Panel the expression profile for the selected gene set should appear in the EM GenesetExpression viewer tab.
- Change the Normalization to your desired metric.
- Change the Sorting method to GSEARanking.
- Genes part of the leading edge are highlighted in Yellow.
Customizing Defaults with Cytoscape Properties
The Enrichment Map Plugin evaluates a number of Cytoscape Properties with which a user
can define some customized default values. These can be added and changed with the Cytoscape
Preferences Editor (Edit / Preferences / Properties…) or by directly editing the file
cytoscape.props within the .cytoscape folder in the User’s HOME directory.
Supported Cytoscape Properties:
- EnrichmentMap.default_pvalue
- Default P-value cutoff for Building Enrichment Maps
- Default Value: 0.05
- valid Values: float >0.0, <1.0
- EnrichmentMap.default_qvalue
- Default Q-value cutoff for Building Enrichment Maps
- Default Value: 0.25
- valid Values: float >0.0, <1.0
- EnrichmentMap.default_overlap
- Default Overlap coefficient cutoff for Building Enrichment Maps
- Default Value: 0.50
- valid Values: float >0.0, <1.0
- EnrichmentMap.default_jaccard
- Default Jaccard coefficient cutoff for Building Enrichment Maps
- Default Value: 0.25
- valid Values: float >0.0, <1.0
- EnrichmentMap.default_overlap_metric
- Default choice of similarity metric for Building Enrichment Maps
- Default Value: Jaccard
- valid Values: Jaccard, Overlap
- EnrichmentMap.default_sort_method
- Set the default sorting in the legend/parameters panel to Hierarchical Clustering,
- Ranks (default the first rank file, if no ranks then it is no sort), Column (default is the first column) or no sort.
- Default Value: Hierarchical Cluster
- valid Values: Hierarchical Cluster, Ranks, Columns, No Sort
- EnrichmentMap.hieracical_clusteting_theshold
- Threshold for the maximum number of Genes before a dialogue opens to confirm if clustering should be performed.
- Default Value: 1000
- valid Values: Integer
- nodelinkouturl.MSigDb.GSEA Gene sets
- LinkOut URL for MSigDb.GESA Gene sets.
- Default Value: http://www.broad.mit.edu/gsea/msigdb/cards/%ID%.html
- valid Values: URL
- EnrichmentMap.disable_heatmap_autofocus
- Flag to override the automatic focus on the Heatmap once a Node or Edge is selected.
- Default Value: FALSE
- valid Values: TRUE, FALSE