Legend Dialog
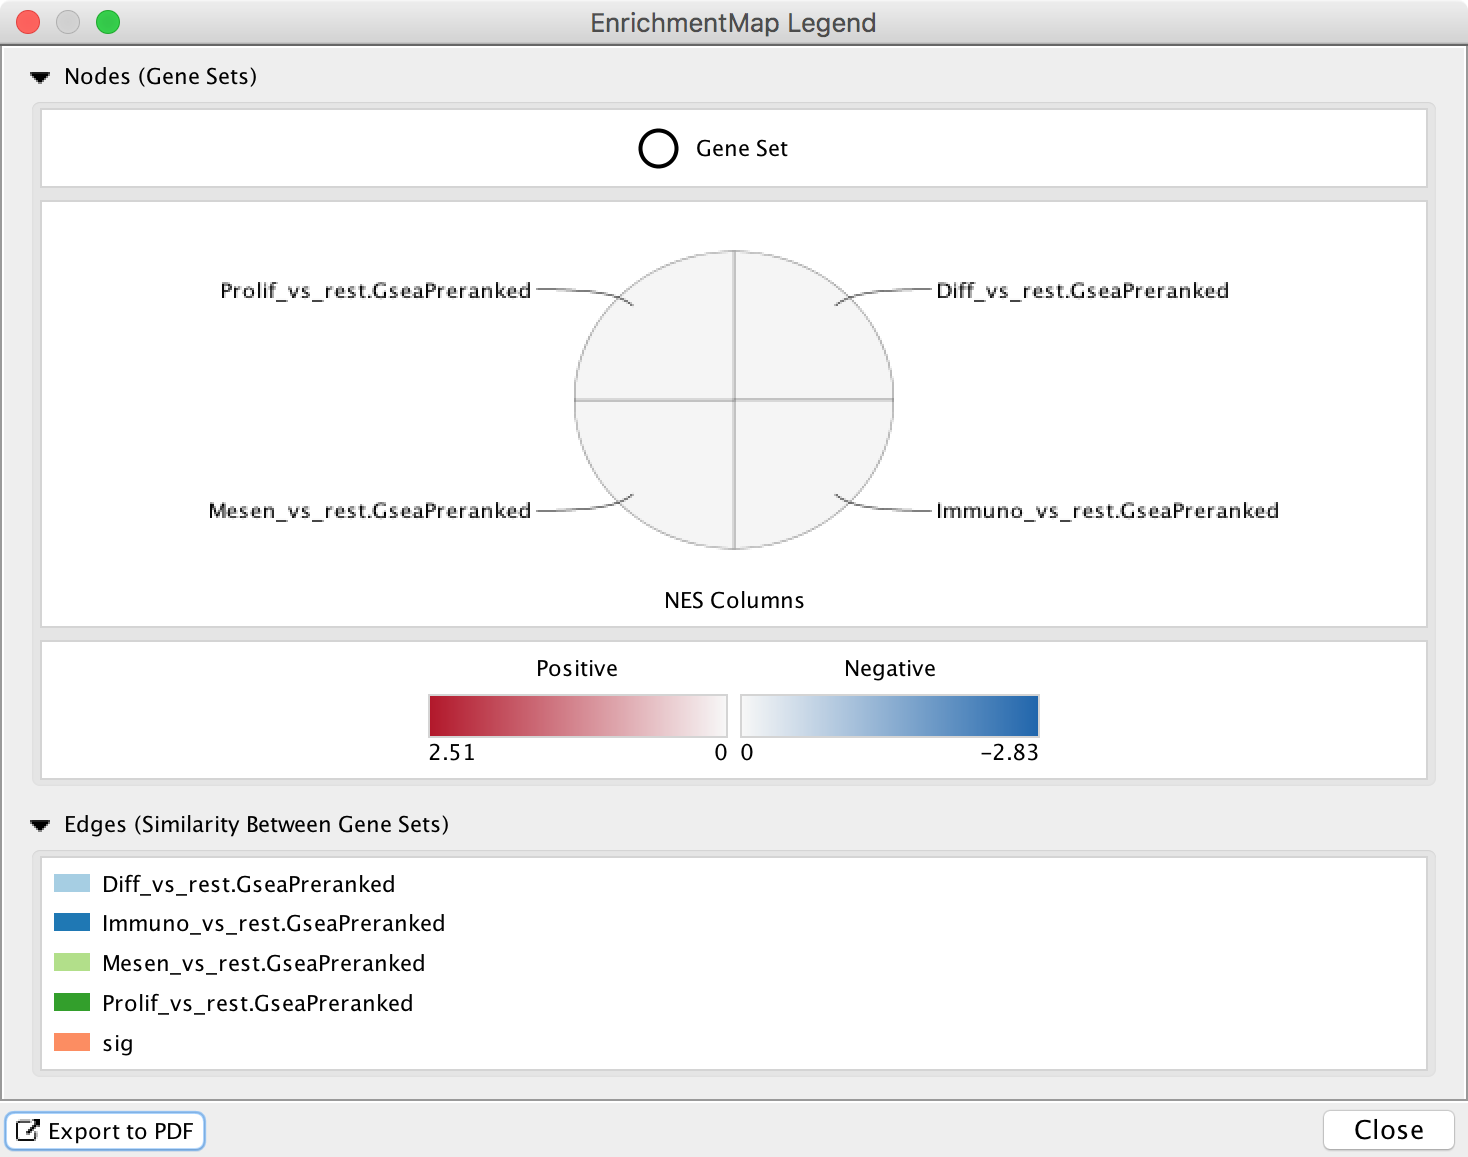
The legend dialog provides a legend for the current network visualization.
The legend dialog can be left open. It will update automatically when changes are made to the network visualization using the 3) Style Section of the main panel.
Sections
Node Color
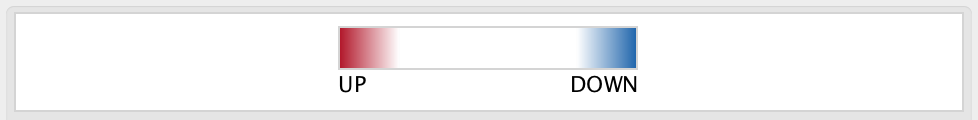
Enabled when there is one data set and chart data is set to none.
Shows the range for the node fill color gradient.
Node Shape

Shows the meaning of node shape.
Shows signature nodes after post analysis has been run.
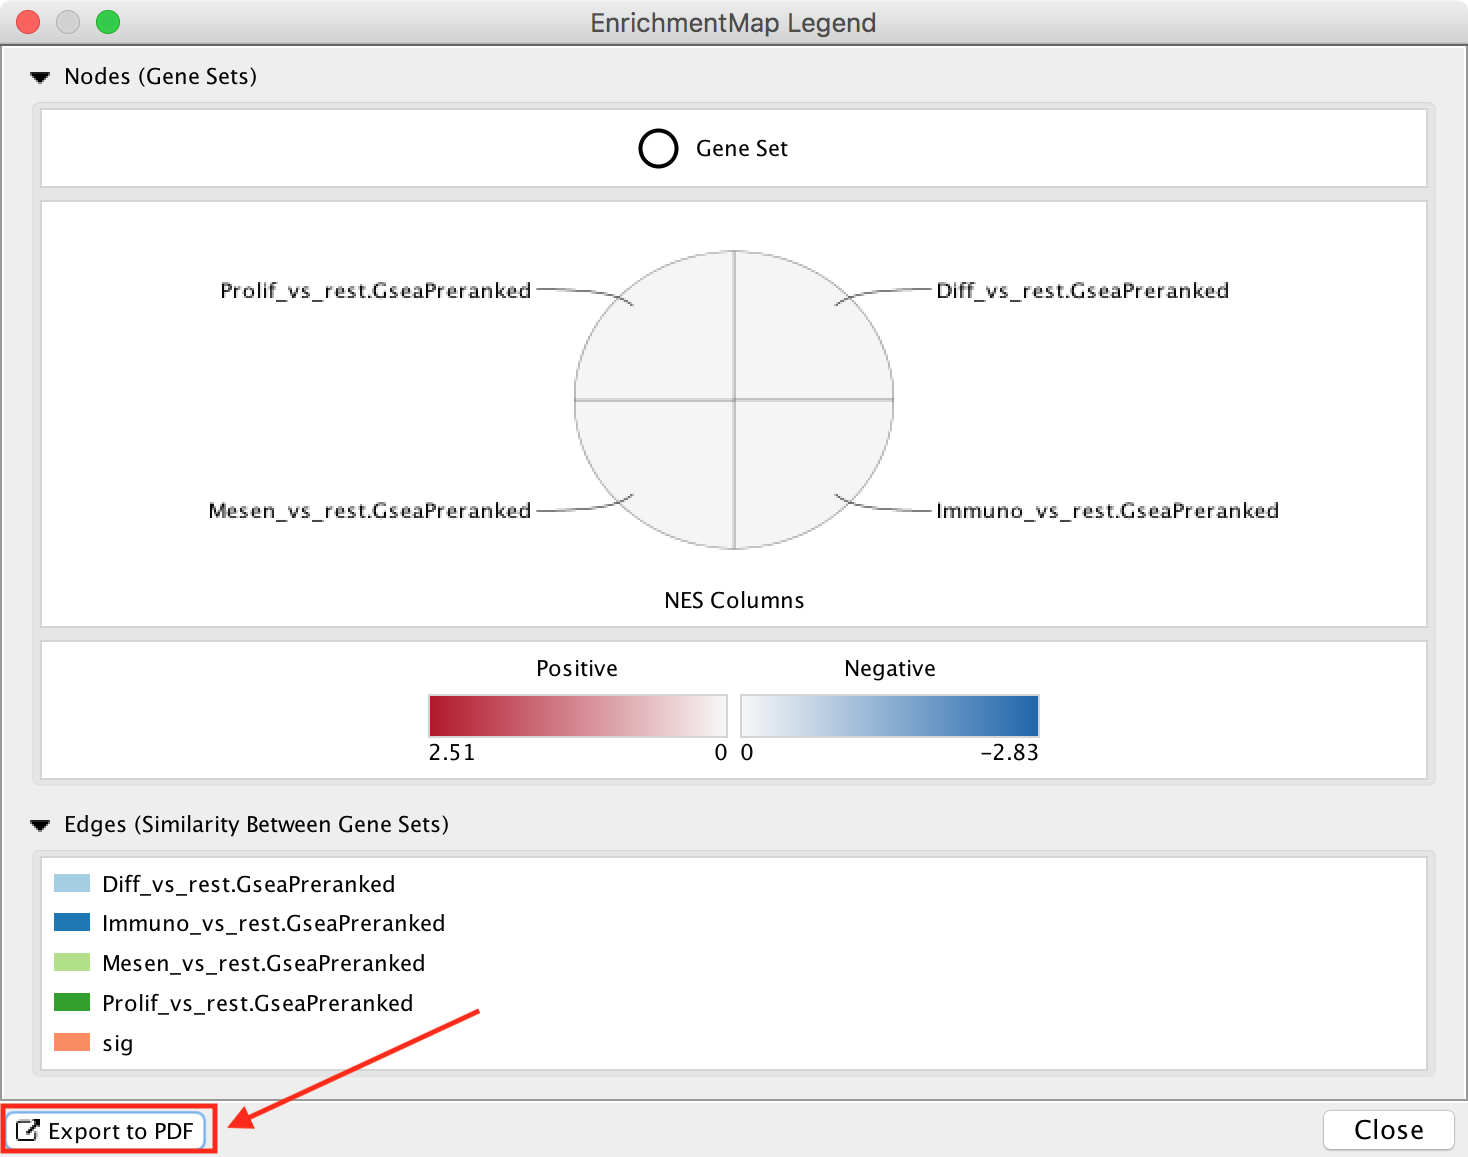
Node Chart
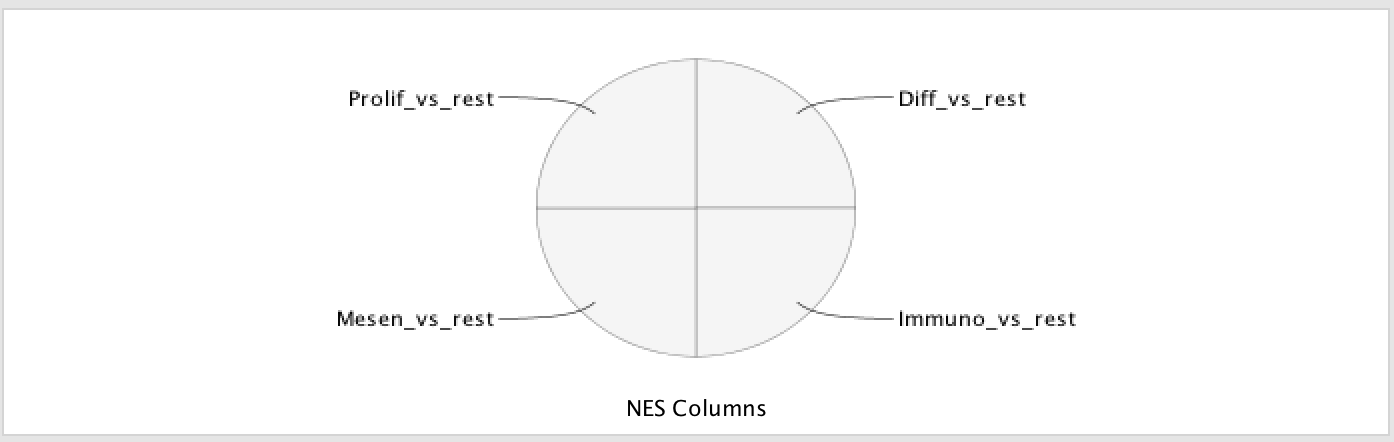
Shows the meaning of the node charts.
Shows how the chart segments map to the data sets.
Node Chart Colors

Shows the color range for the chart segment color gradients.
Data Set Colors
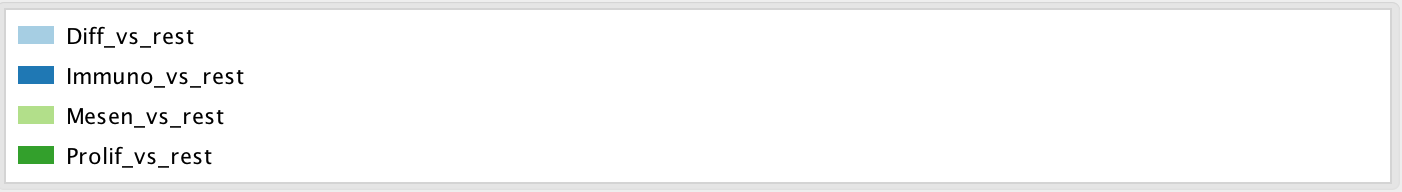
Shows the color for each data set when the Color by Data Set option is chosen.
Edge Color
Shows how edge color maps to data sets.
Export to PDF
The Export to PDF button at the bottom left of the dialog can be used to create a PDF file of the legend.
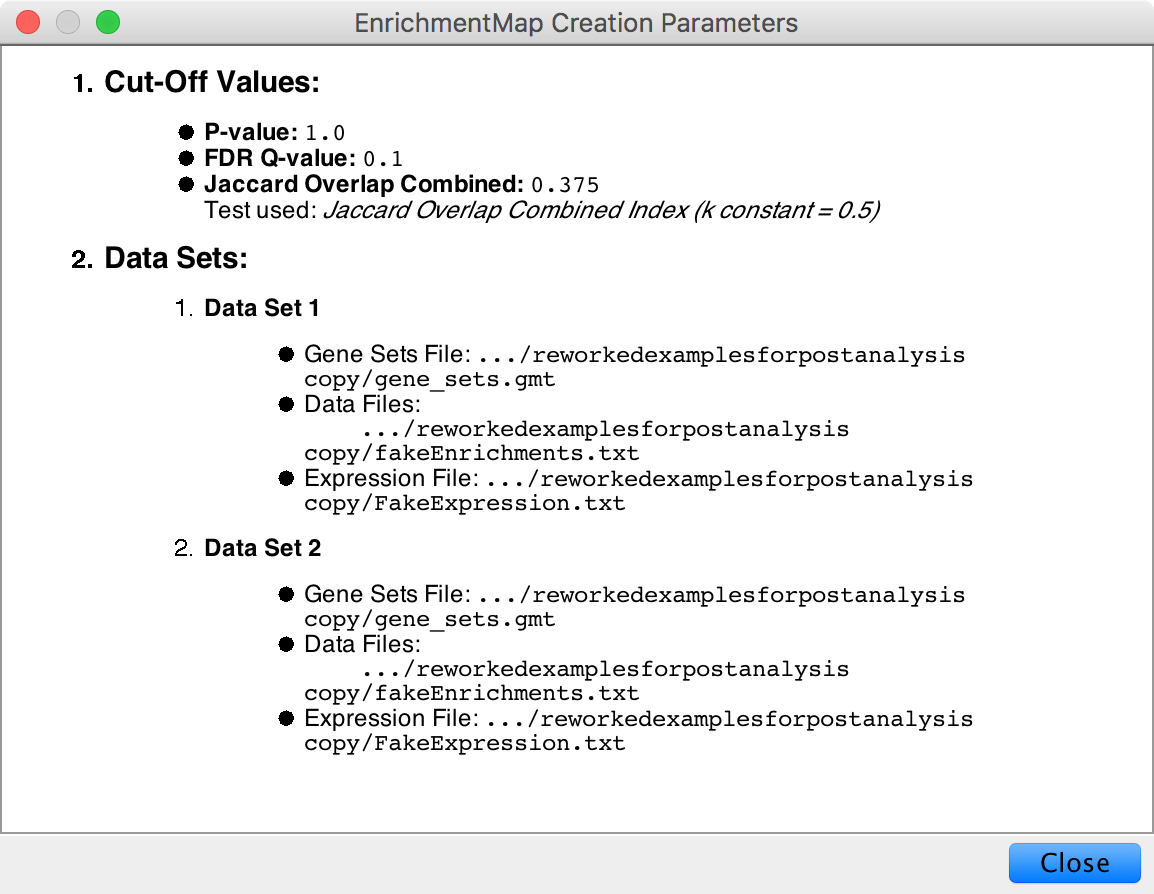
Creation Parameters Dialog
Click the Creation Parameters button at the bottom left of the dialog to open the Creation Parameters dialog. This dialog shows the parameters that were originally entered in the Create EnrichmentMap Dialog when the network was originally created.