Columns
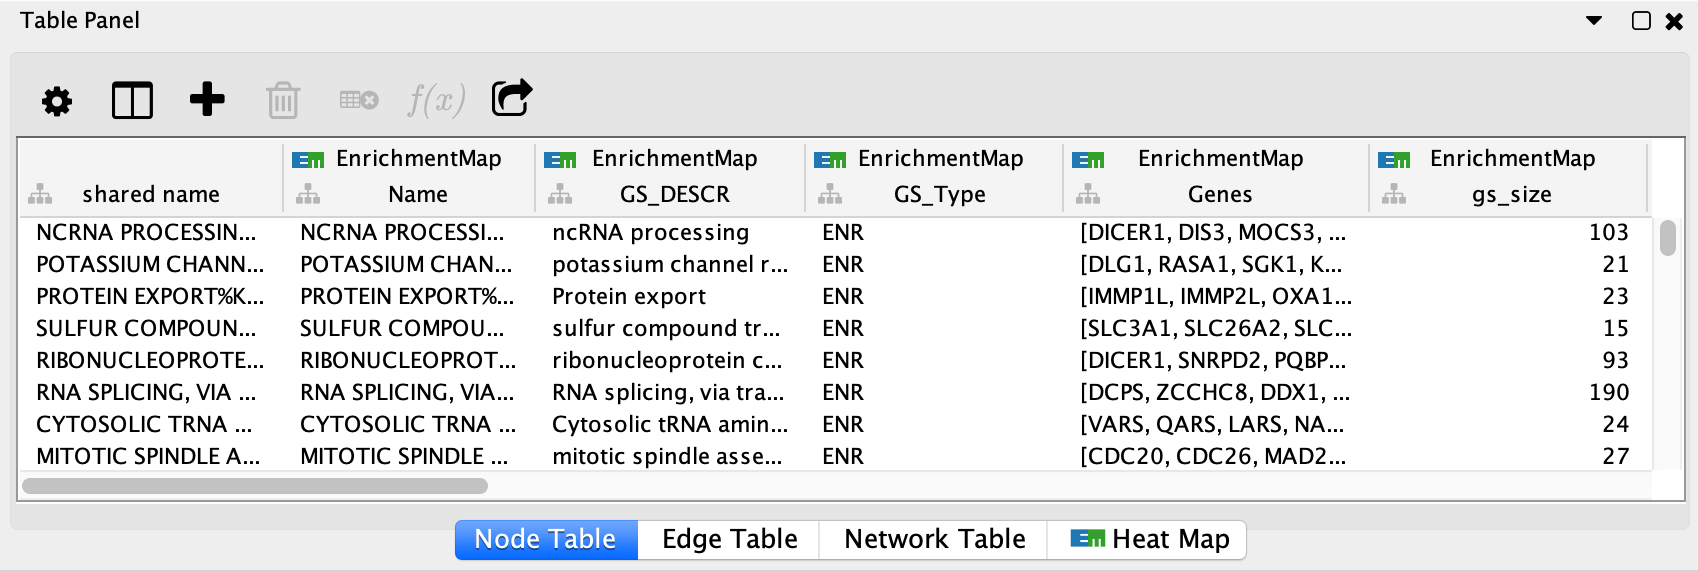
EnrichmentMap creates several columns in the node and edge tables. They can be seen in the Node Table and Edge Table panels.
Columns created by EnrichmentMap have the following pattern:
EnrichmentMap::column_name (data_set_name)
EnrichmentMap::is the namespace prefix. This tells Cytoscape that the column is in the EnrichmentMap namespace.data_set_nameis used to differentiate between data sets. There will be one such column for each data set.
Note
Older versions of EnrichmentMap used the format EM1_column_name for column names.
Node Columns
- EnrichmentMap::Name
The gene set name.
- EnrichmentMap::Formatted_name
A wrapped version of the gene set name so it is easy to visualize.
- EnrichmentMap::GS_DESCR
The gene set description (as specified in the second column of the gmt file).
- EnrichmentMap::Genes
The list of genes that are part of this gene set.
- EnrichmentMap::gs_size
Number of genes the union of the gene set across all data sets.
- EnrichmentMap::GS_Type
Used by the visual style to discern between regular enrichment nodes and signature gene set nodes.
- EnrichmentMap::-log10(pvalue)_max
Maximum value of all the -log10(pvalue) (dataset name) columns.
Additionally there are attributes created for each dataset:
- EnrichmentMap::pvalue (…)
Gene set p-value, as specified in GSEA enrichment result file.
- EnrichmentMap::-log10(pvalue) (…)
Log of the pvalue.
- EnrichmentMap::fdr_qvalue (…)
Gene set q-value, as specified in GSEA enrichment result file.
GSEA specific attributes (these attributes are not populated when creating an enrichment map using the generic mode).
- EnrichmentMap::ES_dataset (…)
Enrichment score, as specified in GSEA enrichment result file.
- EnrichmentMap::NES_dataset (…)
Normalized Enrichment score, as specified in GSEA enrichment result file.
- EnrichmentMap::fwer_qvalue (…)
Family-wise error score, as specified in GSEA enrichment result file.
- EnrichmentMap::-log10(pvalue)*sign(NES) (…)
Log of the pvalue multiplied by the sign (ie 1 or -1) of the NES value. When used for a node color style mapping this allows different colors for up vs down regulated gene sets.
Edge Columns
For each Enrichment map created the following attributes are created for each edge:
- EnrichmentMap::Data Set
Contains the name of the data set that the edge is associated with, or ‘compound’ if the Combine edges across data sets option was selected when the network was created.
- EnrichmentMap::Overlap_size
The number of genes associated with the overlap of the two gene sets that this edge connects.
- EnrichmentMap::Overlap_genes
The names of the genes that are associated with the overlap of the two gene sets that this edge connects.
- EnrichmentMap::similarity_coefficient
The calculated coefficient for this edge.