GSEA Tutorial
This quick tutorial will guide you through the generation of an Enrichment Map for an analysis performed using GSEA Gene Set Enrichment Analysis.
Files
Download the test data: GSEATutorial.zip
Description of the files contained in the GSEATutorial folder:
ES_NT.clsPhenotype definition for expression file required by GSEA.MCF_ExpMX_v2_names.gctExpression File - Estrogen treatment, Official Gene Name as key. - Data for 12hr,24hr and 48hr.Human_GO_AllPathways_no_GO_iea_April_15_2013_symbol.gmtGene set definition file.
Step 1: Generate GSEA output files
- GO to GSEA website
- Click on Downloads in the page header.
- From the javaGSEA Desktop Application right click on Launch with 1 Gb memory.
- Click on “Save Target as…” and save shortcut to your desktop or your folder of choice so you can launch GSEA for your analysis without having to navigate to it through your web browser.
- Double click on GSEA icon you created.
- Click on Load data in left panel.
- Click on Browse for files… in newly opened Load data panel.
- Navigate to directory where you stored tutorial test set files. Select raw expression (.gct) file, sample class file(.cls) and gene set (.gmt) file. Click on Open.
- Wait until confirmation box appears indicating that all files loaded successfully. Click on Ok.
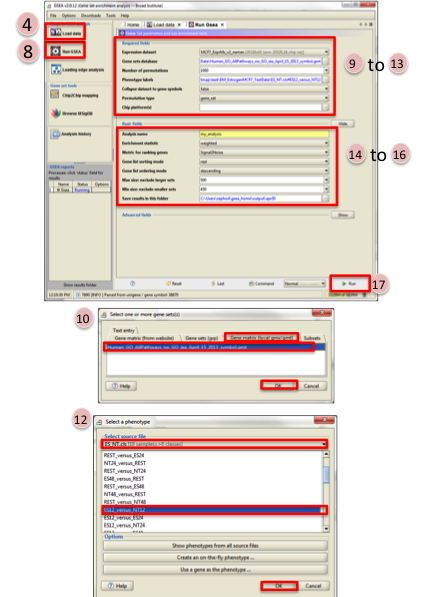
- Click on Run GSEA in left panel.
- Select the Expression dataset:
- Click on the arrow next to the Expression dataset text box.
- Select the expression set you wish to run the analysis on (MCF7_ExprMx_v2_names.gct).
- Select the Gene Set Database:
- Click on next to the text box of Gene Set Database.
- Click on Gene Matrix (local gmx/gmt) tab.
- Select gmt file Human_GO_AllPathways_no_GO_iea_April_15_2013_symbo.gmt and click on Ok.
- Select the Phenotype labels file
- Click on … next to the text box of Phenotype labels.
- Make sure Select source file is set to ES_NT.cls.
- Select ES12_versus_NT12 and click on Ok.
- Click on the down arrow next to the text box for Collapse dataset to gene symbols. Select false.
- Click on the down arrow next to the text box for Permutation type. Select gene_set.
- Click on Show next to Basic fields.
- Click in text box next to Analysis name and rename (example:estrogen_treatment_12hr_gsea_enrichment_results).
- Click on … next to Save results in this folder text box. Navigate to the folder where you wish to save the results (preferably the same directory where all the input files have been saved).
- Click on Run in the bottom right corner.
Note
Repeat steps for the 24hrs time-point but use ES24_versus_NT24 phenotype labels in step 11 instead and in step 15 change the Analysis name (example:estrogen_treatment_24hr_gsea_enrichment_results).
Step 2: Generate Enrichment Map with GSEA Output
GSEA results produced by Step 1: EM_EstrogenMCF7_GSEAresults.zip
- Open Cytoscape
- Locate the Apps tab and select EnrichmentMap > Create Enrichment Map
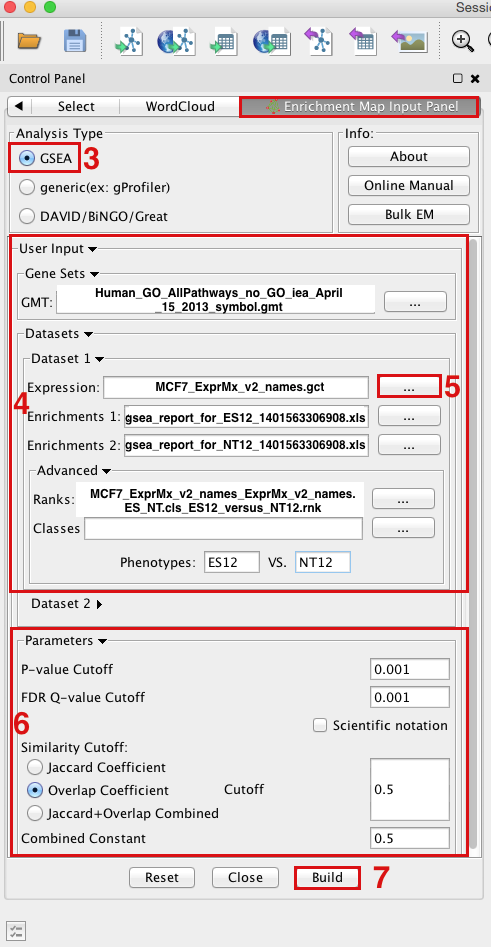
- Make sure the Analysis Type is set to GSEA
- OPTION 1 - Manually load all files Please select the following files by clicking
on the respective (…) button and selecting the file in the Dialog:
- Gene Sets / GMT:
- Human_GO_AllPathways_no_GO_iea _April_15_2013_symbol.gmt (can be found in directory where you extracted the files downloaded in GSEATutorial.zip)
- Dataset 1 / Expression: MCF7_ExprMx_v2_names.gct (can be found in directory where you extracted the files downloaded in GSEATutorial.zip)
- Dataset 1 / Enrichments 1: gsea_report_for_ES12_#############.xls (can be found in directory where you put the GSEA results specified in Part 1, step 15)
- Dataset 1 / Enrichments 2: gsea_report_for_NT12_#############.xls (can be found in directory where you put the GSEA results specified in Part 1, step 15)
- Click on Advanced to expand the panel
- Dataset 1 / Ranks: MCF7_ExprMx_v2_names_ExprMx_v2_names.ES_NT.cls_ES12_versus_NT12.rnk (OPTIONAL) (can be found in directory where you put the GSEA results specified in Part 1, step 15)
- Dataset 1 / Phenotypes 1: ES12 VS NT12 (OPTIONAL)
- OPTION 2 - Populate all fields using GSEA rpt file
- Dataset 1 / Expression : ES12vsNT12.Gsea.#############.rpt (can be found in directory where you put the GSEA results specified in Part 1, step 15)
- NOTE: If you are populating the fields using a rpt file and any of the file names appear in red font then the file EM needs was not found. This can happen if you move your GSEA results folders around after they have been created. For the missing file follow step 5 and re-populate the effected fields.
- Tune Parameters
- P-value cut-off: 0.001
- Q-value cut-off: 0.05
- Overlap coefficient cut-off: 0.5
- Build Enrichment Map
- Go to View, and activate Show Graphics Details
Step 3: Examining Results
Example EM session - Estrogen treatment vs no treatment at 12hr
ES12_EM_example.cys
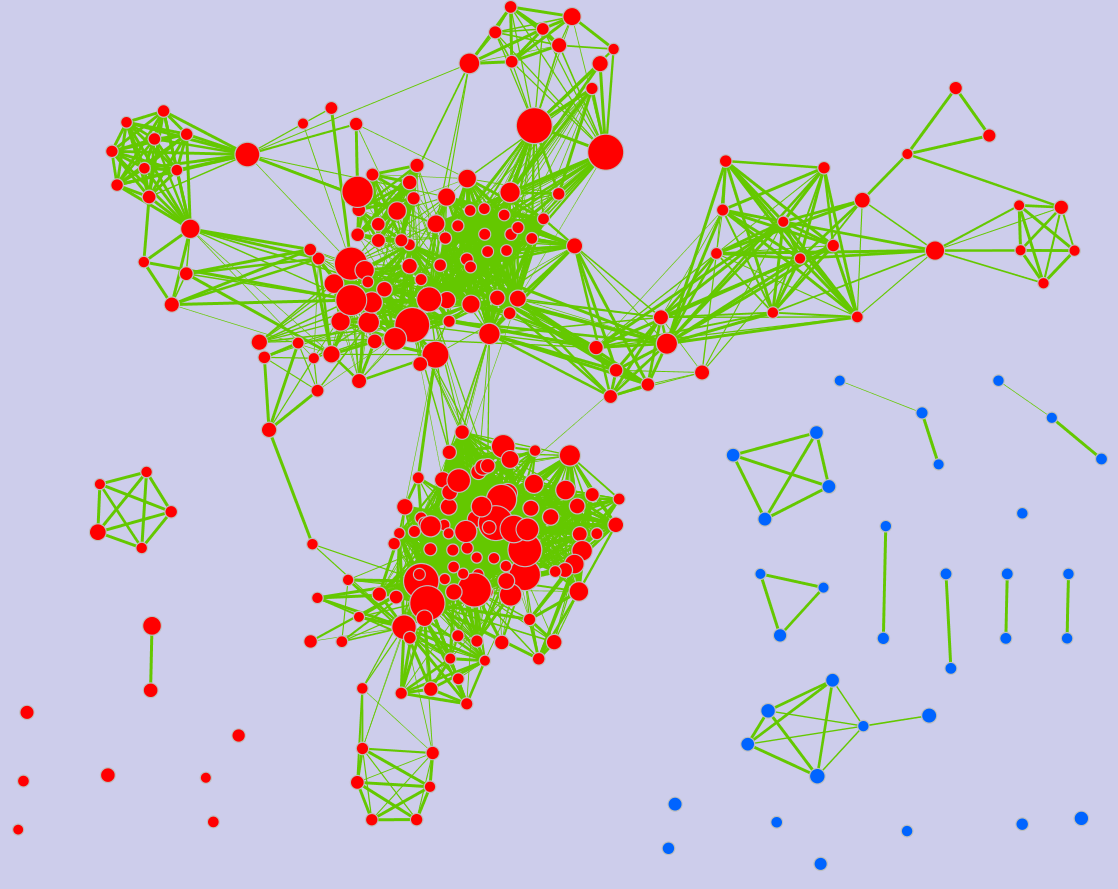
Legend:
- Node (inner circle) size corresponds to the number of genes in dataset 1 within the geneset
- Colour of the node (inner circle) corresponds to the significance of the geneset for dataset 1.
- Edge size corresponds to the number of genes that overlap between the two connected genesets. Green edges correspond to both datasets when it is the only colour edge. When there are two different edge colours, green corresponds to dataset 1 and blue corresponds to dataset 2.
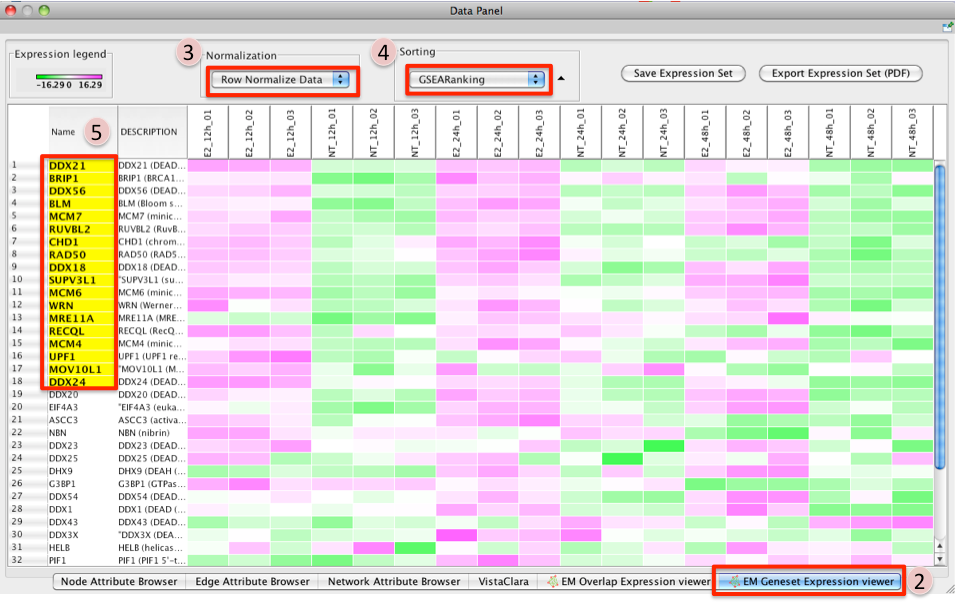
GSEA Leading Edge Information:
- Click on a node (gene set) in the Enrichment map.
- In the Data Panel, expression profile of all genes included in the selected gene-set should appear in the Heat Map (nodes) viewer tab
- Change the Normalization to your desired metric.
- Change the Sorting method to GSEARanking.
- Genes part of the leading edge are highlighted in yellow.
Note
Leading edge information is currently only available when looking at a single gene set.
More Tutorials
For more detailed tutorials check out:
- Merico D, Isserlin R, Bader GD.Methods Mol Biol. 2011;781:257-77. doi: 10.1007/978-1-61779-276-2_12.
- Isserlin R, Merico D, Emili A.Methods Mol Biol. 2013;1005:53-66. doi: 10.1007/978-1-62703-386-2_5.